ESG Intelligence tool is an industry agnostic business intelligence platform, used to assist companies across all sectors monitor and report their Environmental, Social and Governance performance.
The tool is built in a Microsoft’s Power BI solution, a cloud-based business analytics application that performs data acquisition and transformation, data modeling and visualization with increased speed and efficiency to deliver insights that enable fast, informed decisions. It meets the highest safety and cyber security standards and is easily accessible by licensed users using their mobile devices, laptops, PC or tablets.

Powerful new technologies and advanced analytical tools can play a critical role in underpinning the solutions needed to tackle the most pressing challenges.
The starting point of this conversation includes the establishment of a cutting-edge data processing technologies (big data), integrated dashboard (BI) reporting solution, incorporating the latest technological advances (incl. IoT real streaming), that can offer the ability to collect, process and analyse vessels’ operational data through tailor-made Key Performance Indicators (KPIs), aiming to provide insights and intelligence based on operational related preventing warnings and forecasts on performance, technical operations and maintenance even at a real-streaming time frequency.
In particular, an integrated solution should encapsulate key capabilities such as:
Introducing a comprehensive reporting solution that may enable enterprises to efficiently monitor key performance metrics, while taking a proactive stance towards long-term challenges, should be placed at the top of the management agendas
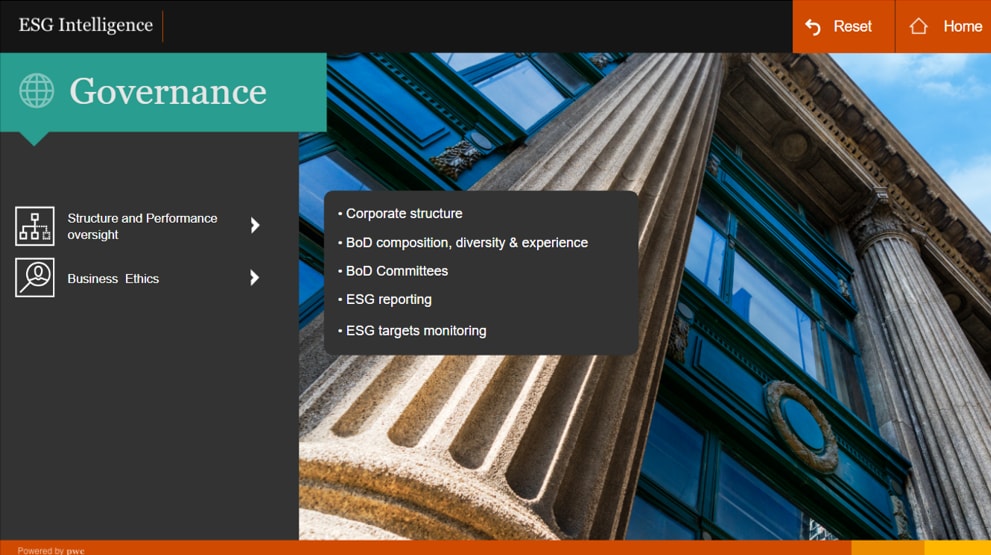
All information included in the tool is divided in 3 main pillars; Environment, Social and Governance.
Data are collected and uploaded on a predetermined frequency (daily, monthly, annually, etc.) to the ESG tool. Alternatively, data are automatically uploaded (i.e. through integration with the existing systems). All KPIs are automatically calculated and are visualized in various formats (i.e. graphical representation, infographics, tabular form). Moreover, the user is able to filter the respective information in order to select one or multiple dimensions (i.e. time period, calculation methods, etc.). In addition the user can extract the relevant information and produce reports in a standardized format, which can meet the requirements of various stakeholder groups (i.e. verifiers, customers, financial institutions, etc.).


Data are collected on a predetermined frequency (i.e. monthly, quarterly or annually) through various input sources. Indicative input sources include:
- Standardized input forms (i.e. in the form of an excel spreadsheet or csv file), which are developed, based on the unique requirements of each company.
- Existing ERP systems. Our tool is integrated with existing systems (i.e. procurement, commercial, hr, health and safety modules of ERPs) and automatically retrieves relevant information on a predetermined frequency.
- Publicly available information, depicting company’s data (i.e. corporate web site, public fillings in the form of 20-f, etc.)
- Manual data input by the users
Learn more about our Data & Analytics service here
Contact us


