Q4 2016 Equity Capital Markets Briefing
2016, the year in review
Throughout 2016, shipping stock prices have been subject to extreme volatility and lacked liquidity. With limited access to the US capital markets, our clients and the broader shipping industry, have been focused on debt restructuring and finding other sources of debt and equity, through either private placements or private investors.
Globally, IPO activity decreased and Follow-On issuances remained broadly at the same level. The shipping industry did see some limited capital market activity - through either the issuance of bonds, preferred securities or Follow-Ons and the successful listing of a SPAC.
Looking ahead to 2017, PwC is hoping that the new year will bring the re-opening of the US capital markets to the shipping industry!
Santos Equitz, Capital Markets and T&L Industry Leader

In the wake of the US election, financial markets were lifted to record highs. Trump’s inflationary policies pushed economic growth expectations higher, while an OPEC agreement to cut production provided further support for higher inflation and monetary tightening. Thus the Fed lifted rates in December, and the ECB extended asset purchases albeit at a slower pace (largely interpreted as the end of ultra-loose monetary policy). Finally, as Renzi lost his Italian referendum he made way for a new prime-minister, though the impact on financial markets was smaller than expected.
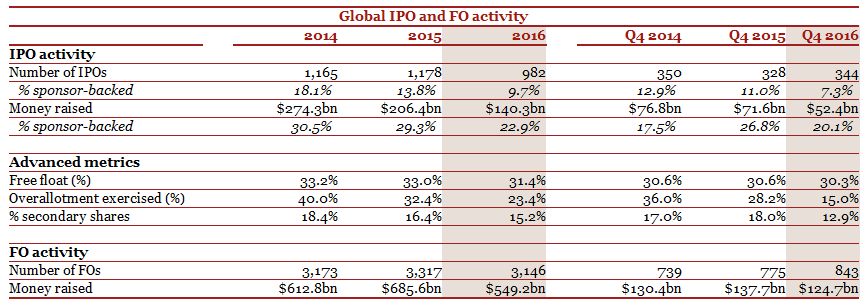
Global IPO and FO issuance in 2016 was rather disappointing, as geopolitical worries took centre stage. In total, 2016 saw 982 IPOs raise $140.3bn compared to $206.4bn via 1,178 IPOs in 2015 and $274.3bn via 1,165 IPOs in 2014. In terms of FOs, 3,146 deals raised $549.2bn, as opposed to proceeds of $685.6bn via 3,317 in 2015 and $612.8bn via 3,173 in 2014.
In line with previous years, the fourth quarter was the strongest for IPOs in 2016, both in terms of numbers and proceeds. Nonetheless activity was fairly limited when compared to previous years. It stood at $52.4bn via 344 IPOs in Q4 2016, compared to $71.6bn via 328 IPOs in Q4 2015 and $76.8bn via 350 IPOs in Q4 2014. For FOs, activity was weaker than the second and third quarters of 2016, and also disappointed when compared to previous years. Proceeds stood at $124.7bn via 843 deals, compared to $137.7bn via 775 deals in Q4 2015 and $130.4bn via 739 deals in Q4 2014.
In 2016, Asia-Pacific accounts for 55% ($76.6bn) of proceeds and 67% (661) of the number of IPOs. EMEA ranks second in terms of both proceeds ($35.5bn) and numbers (178), while the Americas comes in last with proceeds of $29.5bn via 144 IPOs. However, in terms of FO activity the Americas stands atop the league table by accounting for 40% ($219.3bn) of proceeds and 34% (1,067) of the number of deals, with Asia-Pacific trailing by a small margin. EMEA ranks third.
When looking at quarterly figures, these regional differences persisted in Q4, with Asia-Pacific leading the way in terms of IPOs, accounting for 57% ($29.7bn) of proceeds and a massive 72% (246) of the number of IPOs. EMEA ranks second with 56 IPOs raising a total of $12.4bn. Finally, with proceeds of merely $10.3bn via 42 IPOs the Americas ranks last. In terms of FOs, the latter region outperformed Asia-Pacific, accounting for 39% ($48.4bn) of proceeds and 35% (295) of deals. EMEA was again least active, trailing the other two regions in terms of FO activity all year.
Financials (including Closed-End Funds and Real Estate) proved to be the most active sector in terms of IPO proceeds in both Q4 and the year as a whole, particularly bolstered by multi-billion offerings in Asia-Pacific. The amount of money raised by the sector stood at $11.8bn via 64 IPOs for the quarter and $50.9bn via 195 IPOs for 2016 in total. Nonetheless, the sector was outranked in terms of the number of IPOs by Industrials in Q4 (78) and for the year as a whole (223). In terms of FOs, Financials are also the most active sector both in the fourth quarter and in 2016.
The global median current performance of IPOs remains strong this year, at 21% for 2016 IPOs and 10% for 2015 IPOs. This is driven by returns in Asia-Pacific, where the median 2016 IPO displays an increase in share price of 42%. Notably, both the average and median 1-day performance of all IPOs in China in 2016 reached the maximum permissible 44% increase (as determined by the regulator). Returns to date were second-highest in the Americas with a 9% increase for all IPOs in 2016. Finally, in EMEA those companies going public in 2016 displayed a median share price increase of 7%.
In terms of pricing dynamics, the number of IPOs pricing within the initial price range (89%) is higher than previous years. In the EMEA region, 98% of IPOs priced within the initial price range, as compared to 95% in Asia-Pacific and 61% in the Americas.
Financial sponsor-backed IPO activity in Q4 accounted for 20% ($10.5bn) of proceeds and 7% (25) of the number of deals. The Americas represent the most active region, accounting for 51% ($5.2bn) of proceeds and 26% (11) of the number of IPOs. For the year as a whole, financial sponsor-backed IPOs accounted for 23% ($32.2bn) of proceeds and 10% (95) of the number of deals.

Initial Public Offerings
Asia-Pacific was the epicentre of IPO activity in 2016, both in terms of money raised and number of deals
Across the global regions:
IPO activity remained constant in the Americas compared to the previous quarter, and the same quarter last year. In Q4 2016, proceeds totaled $10.3bn via 42 IPOs, compared to $11.9bn via 52 IPOs in Q4 2015. As a result, the region ranks last in terms of both proceeds and the number of IPOs. For the year as a whole, the region also ranks last by accounting for 21% ($29.5bn) of proceeds 15% (144) of the number of IPOs.
The largest IPO in the Americas in the fourth quarter of 2016 and for the full year was ZTO Express, a delivery service, which raised $1.4bn on NYSE in October. Second in the fourth quarter came Athene Holding, an insurance company, raising $1.2bn on NYSE in December. Finally, in third place stands Extraction Oil & Gas, which as the name implies is involved in the exploration and production of oil and gas, and raised $728m on NASDAQ in October.
As mentioned earlier, financial sponsor-backed IPO activity was strong in the fourth quarter in the Americas, displaying levels usually seen in EMEA. FS-backed IPOs accounted for 51% of proceeds and 26% of the number of IPOs. For the year as a whole, this means FS-backed activity accounted for 39% of proceeds and 24% of the number of IPOs in the Americas.
In EMEA IPO activity increased almost threefold compared to the weak third quarter, but ultimately still disappointed compared to the same quarter in previous years. Though economic fundamentals are improving, political worries weigh on investors’ minds. In the fourth quarter $12.4bn was raised via 56 IPOs, compared to $25.0bn via 77 IPOs in Q4 2015. This places the region second in terms of both proceeds and number of IPOs. The same applies for the entire year, as EMEA accounted for 25% ($35.5bn) of global money raised, and 18% (178) of the number of IPOs.
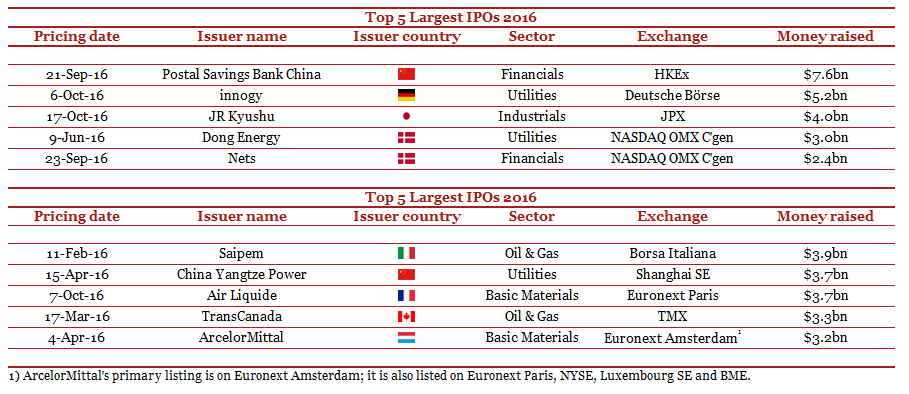
The largest IPO in EMEA in the fourth quarter of 2016 and for the full year was innogy, a carve-out from the German energy giant RWE. It raised $5.2bn on Deutsche Börse in October. In second place came ConvaTec Group, which raised $1.9bn on the LSE in October. The company is active in the medical technology business. Finally, in third place stands Ahlsell, a Swedish wholesaler of tools and supplies. It raised $772m on NASDAQ OMX Stockholm, also in October.
Unlike previous quarters, the presence of financial sponsor-backed IPOs was proportionately low. They accounted for 27% ($3.4bn) of proceeds and only 11% (6) of the number of IPOs. Since the start of 2012, only three quarters have displayed lower FS-backed IPO activity in the region. Nonetheless, for the year as a whole financial sponsor-backed IPOs still account for 45% of proceeds and 22% of the number of deals.
In line with earlier quarters, Asia-Pacific was also the most active region in the fourth quarter of 2016. Geopolitical worries surrounding the US election were farther removed from this region, as it accounted for 57% ($29.7bn) of proceeds and 72% (246) of the number of IPOs. This compares to proceeds of $34.6bn in Q4 2015, via 199 IPOs. China alone accounted for over a third of proceeds and almost half of the number of IPOs, as the healthy pipeline of IPO candidates together with an acceleration of approvals by the China Securities Regulatory Commission in November keep markets running. For the second year in a row, the region ranks first by accounting for 55% ($76.6bn) of proceeds and an impressive 67% (661) of the number of IPOs in the whole of 2016.
The three largest IPOs in Asia-Pacific in the fourth quarter of 2016, however, were not in China. JR Kyushu, the state-run Japanese railway operator, raised $4.0bn on the Tokyo SE in October, making it the 2nd largest IPO of the year in the region. Samsung BioLogics raised $2.0bn on the Korean Stock Exchange in October. Finally, China Resources Pharmaceutical Group opted for HKEx to raise $1.9bn in October. The largest IPO of the year in both the region and globally remains the Postal Savings Bank of China, which raised $7.6bn on the HKEx in September.
Financial sponsor-backed IPO activity remained weak in Asia-Pacific in the fourth quarter, accounting for merely 6% ($1.9bn) of proceeds and 3% (8) of the number of IPOs. This is comparable to the representation enjoyed by FS-backed IPOs over the whole year, at 6% ($4.5bn) of proceeds and 3% (22) of the number of IPOs.
Follow-ons
Financials represent the most active sector in terms of money raised and number of FOs, whilst Industrials rank second
Global FO activity decreased both on a quarter-by-quarter basis, and compared to the same quarter last year. Notably, 843 deals raised $124.7bn, compared to 775 deals raising $137.7bn in Q4 2015. In terms of the number of FOs, activity was evenly spread over the three regions. However in terms of proceeds the Americas and Asia-Pacific accounted for a large majority. The same holds for the year as a whole, as the Americas and Asia-Pacific both account for approximately 40% of proceeds and number of deals.
The largest FO this quarter was Air Liquide, raising $3.7bn on Euronext Paris in October. The company is engaged in the production and distribution of industrial gases. Next came TransCanada, which now has 2 FOs in the top 10 of 2016. In November the energy company raised $2.6bn on TMX. Finally, department store operator Hainan Island Construction collected $2.4bn in Shanghai, in a cash placing FO transaction in October.
In line with IPO markets, Financials were again the most active sector in the FO market. By raising $22.7bn via 174 FOs in the fourth quarter, they account for 18% of proceeds and 21% of the number of transactions. Furthermore, just as in previous quarters Industrials rank second with proceeds of $21.0bn via 157 deals in the fourth quarter. This ranking also holds true for the year as a whole.
Pipeline
The global IPO pipeline for 2017 looks quite promising, despite some uncertainties
The global IPO pipeline for 2017 looks quite promising, despite the expectation that monetary conditions will slowly tighten in the US and Europe. Although this could lead to higher interest rates and a potential correction in equity prices, we believe that the IPO market will remain open with liquidity available for the right companies at the right price. Several geopolitical uncertainties will become certainties throughout the year and on the back of healthy investor sentiment, reasonably high equity valuations and IPOs generating positive returns, we expect global IPO activity to improve in 2017 as compared to 2016.
Nonetheless a difference is expected to persist between regions. In the Americas, the IPO market is expected to pick up in 2017. The pipeline for the region particularly looks healthy for the US, after 2016 represented the weakest year in terms of IPO activity since 2009. Several jumbo transactions will likely hit the market, among others in the Technology sector. Furthermore, the Trump administration in the US could potentially implement supportive policies. Within EMEA, investors will among others be looking at elections in France, Germany and the Netherlands, which have the potential to unsettle the IPO markets across Europe. Despite the uncertainty that this brings, the European IPO pipeline looks decent. Last but not least, the Asia-Pacific region is heading towards another successful year, mainly driven by China and Hong Kong. With a large number of companies in the China Securities Regulatory Commission pre-IPO list, a steady pipeline in Hong Kong and the effect of monetary and fiscal stimulus boosting growth in Japan, IPO activity should remain strong throughout the year.


