


The latest global projections from the PwC Network suggest global growth to moderate somewhat, at 2.6% in 2025 and 2026, down from 2.8% in 2024, as geopolitical uncertainties and increased protectionism dampen the outlook.
The US economy is expected to grow at just over 2% and China’s growth moderating to around 4.5%. Growth is expected to remain slow in the eurozone, at 1.1% in 2025, picking up marginally to 1.3% as the German economy recovers somewhat. Meanwhile India’s economy remains robust, with growth expected to be over the 6% mark. Within this context, Malta’s actual growth of 6% in 2024, and forecast growth of around 4% over the next two years, appears relatively strong.
GDP growth in Malta remained strong in FY24, although decelerating somewhat from 6.8% to 6.0%; projected to dip below the 4% mark by 2026.
Real GDP Growth
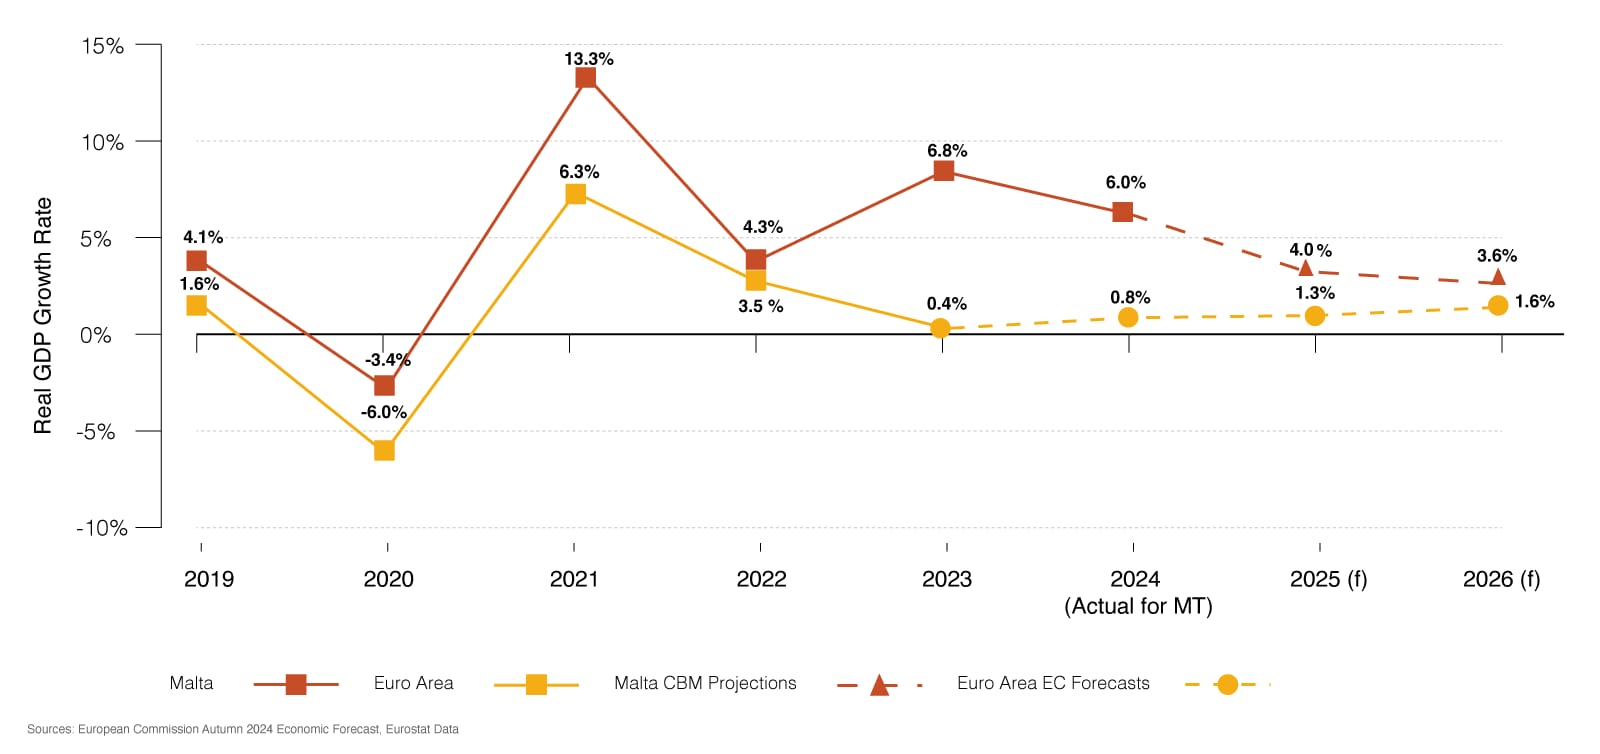
Sources: European Commission Autumn 2024 Economic Forecast, Eurostat Data
Malta's Real GDP growth rate is forecasted to decline over the next two years, from 6% in 2024 to 4% in 2025 and 3.6% in 2026. In contrast, GDP growth within the Euro Area is anticipated to experience a moderate increase, rising from 0.8% in 2024 to 1.3% in 2025 and reaching 1.6% by 2026. Consequently, Malta's real GDP growth is projected to remain higher than that of the Euro Area, although the disparity is expected to narrow over time.
From a sectoral perspective, real estate, construction, financial services and public sector appear to be driving growth; slowdowns registered in professional services and manufacturing.
When analysing economic performance at a sectoral level, it appears that not all industries grew in line with Malta’s overall GDP growth. Growth in the real estate and construction sectors outpaced national growth, as did education and finance. However, traditionally more high-performing and higher value-added sectors, such as professional services, ICT and arts & entertainment (which includes i-gaming), slowed down or even contracted slightly.
When considered on an output-per-employee basis, the ICT, professional services and finance sectors continue to lead in terms of productivity per worker, followed by more traditional industries which registered lower levels of productivity.
ICT, finance and professional services registered strong employee output levels for both 2023 and 2024 with little movement YoY, Followed closely by the Arts & Entertainment sector. The remaining industries observed more modest output levels per employee, including wholesale & retail and the public sector, which together make up a substantial portion of total output.
It is interesting to note that in 2024, the higher value-added sectors grew at a slower rate, with growth being driven largely by the less productive sectors.
Contact us


