This analysis highlighted insights from the annual benchmarking review carried out in relation to the financial key performance indicators of selected asset managers in Singapore.
Our benchmarking insights is designed to gather, analyse and share information about key industry trends and metrics. This report summarises the key financial information relevant to asset managers in benchmarking their financial performance against industry peers.
In 2023, asset managers experienced a dynamic year marked by significant growth and notable challenges. Major market indexes witnessed substantial year-on-year growth, with the Nasdaq Composite at 44.5%, Russell 2000 at 15.8%, S&P 500 at 24.7%, and Dow Jones Industrials at 13.7%.[1] The global AUM increase by 12%, and Singapore’s asset management industry also advanced by 10% to S$5.4 trillion but the net inflows sharply dropped from S$435 billion to S$193 billion.[2] The geopolitical landscape was significant impacted by the conflicts such as Israel-Hamas war and Russia-Ukraine war, adding to the existing economic uncertainty. Additionally, persistent high interest rates throughout the year posed further challenges for the industry.
Amid this volatile market environment, among the 47 asset managers we selected for this report, the financial performance of global asset managers (GAMs) and hedge fund managers (HFs) was notably weaker on average. In contrast, private equity firms (PEs) continued to offer diversification from the macroeconomic climate and maintained robust financial performance.
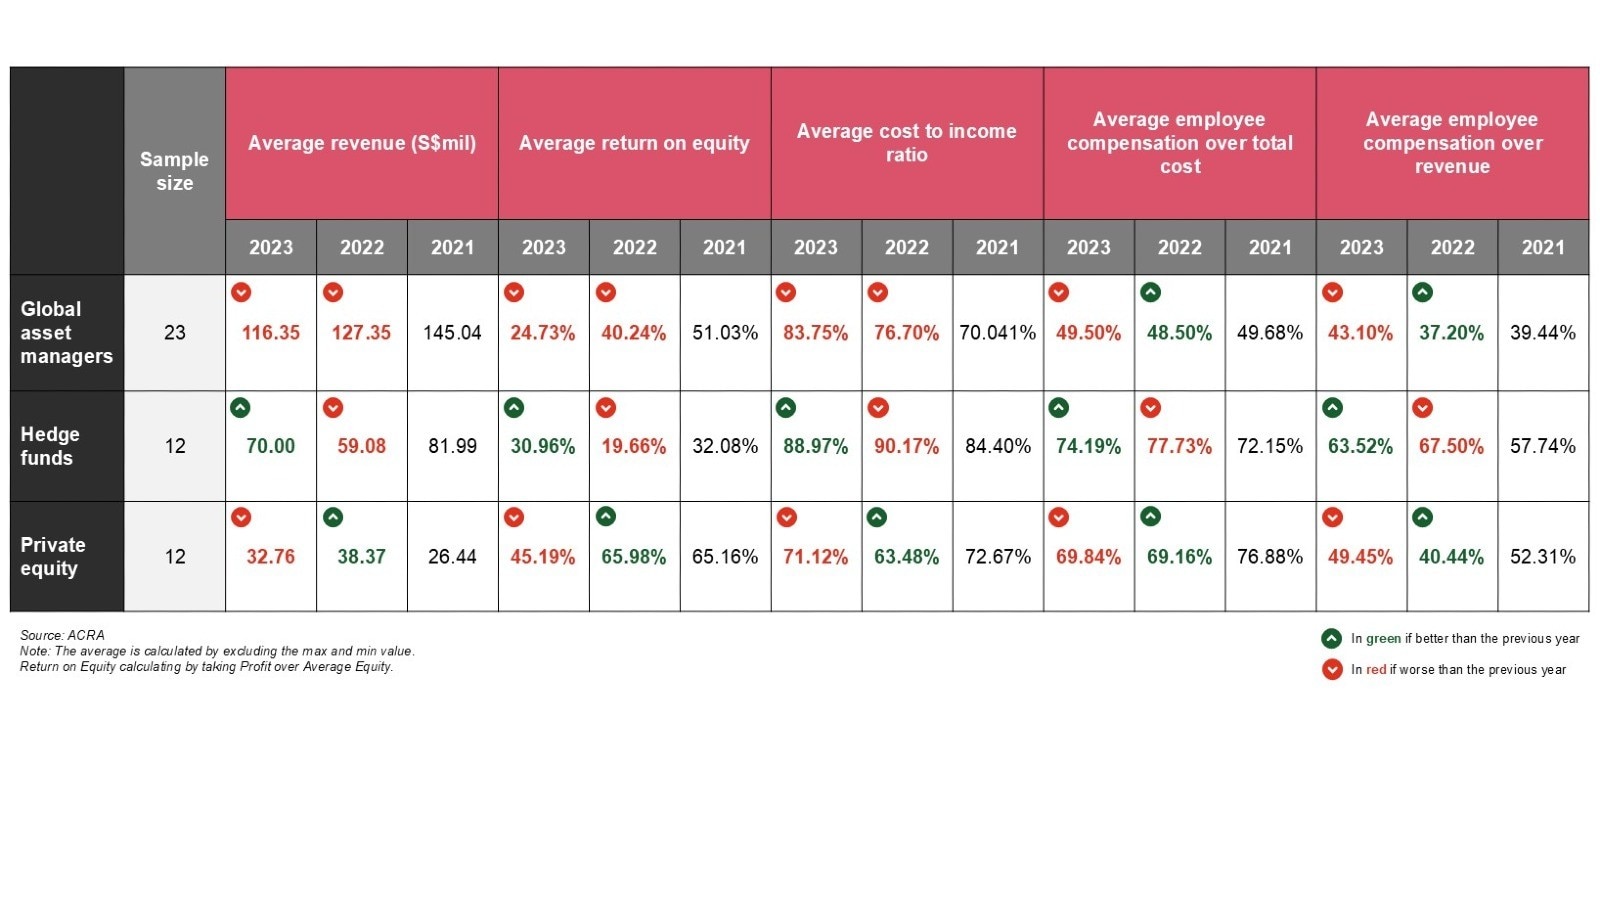
GAMs saw their average cost-to-income ratio (CIR) rise by 7.05% to 83.75%. Meanwhile, their average return on equity (ROE) experienced a significant decline from 40.24% to 24.73%, and the employee compensation as a percentage of total cost (Employee Cost %) increased slightly by 1.00% to 49.50%.
Hedge funds had an average CIR of 88.97% and the highest Employee Cost % of 74.19%. However, their average ROE saw a surge from 19.66% to 30.96%, making their ROE higher than GAMs.
Private equity firms stood out with the highest average ROE in 2023 of 45.19%, but marking a 20.79% decrease from 2022. Their average CIR increased to 71.12% and their Employee Cost % remained similar at 69.84%, surpassing GAMs and almost on-par with HFs.
In summary, 2023 presented a mixed landscape for asset managers with varying performance from the asset managers. While 2023 was a year of recovery and growth for hedge funds, both private equity firms and GAMs continued to navigate the complex environment with positive outlook.
[1] Bloomberg.
[2] MAS Asset Management Survey Report 2023
Overview of financial KPIs in asset managers
While the core business model of asset managers may appear similar, each asset manager possesses a distinct investment scope, strategy, and market focus, leading to variations in their financial performance.
In 2023, private equity firms demonstrated the lowest average cost-to-income ratio when compared to hedge funds and global asset managers. These metrics highlight the efficiency and cost-effectiveness of private equity firms in managing their operations partly due to the nature of business and operating scalability, as well as strategic use of outsourcing to external parties.
In terms of return on equity, private equity firms emerged as the top performers, boasting the highest average return. In contrast, global asset managers reported the lowest return on equity on average. These figures underscore the superior profitability and performance of private equity firms in the financial landscape, under the current economic and financial market environment.
In 2023, HFs had a better overall performance --- higher average revenue and return on equity, lower cost to income ratio, employment compensation over total cost, and employee compensation over revenue. On the other hand, GAMs and HFs experienced decreasing average revenue and return on equity, and an increasing average cost to income ratio, employee compensation over total cost and employee compensation over revenue.
Explore other metrics
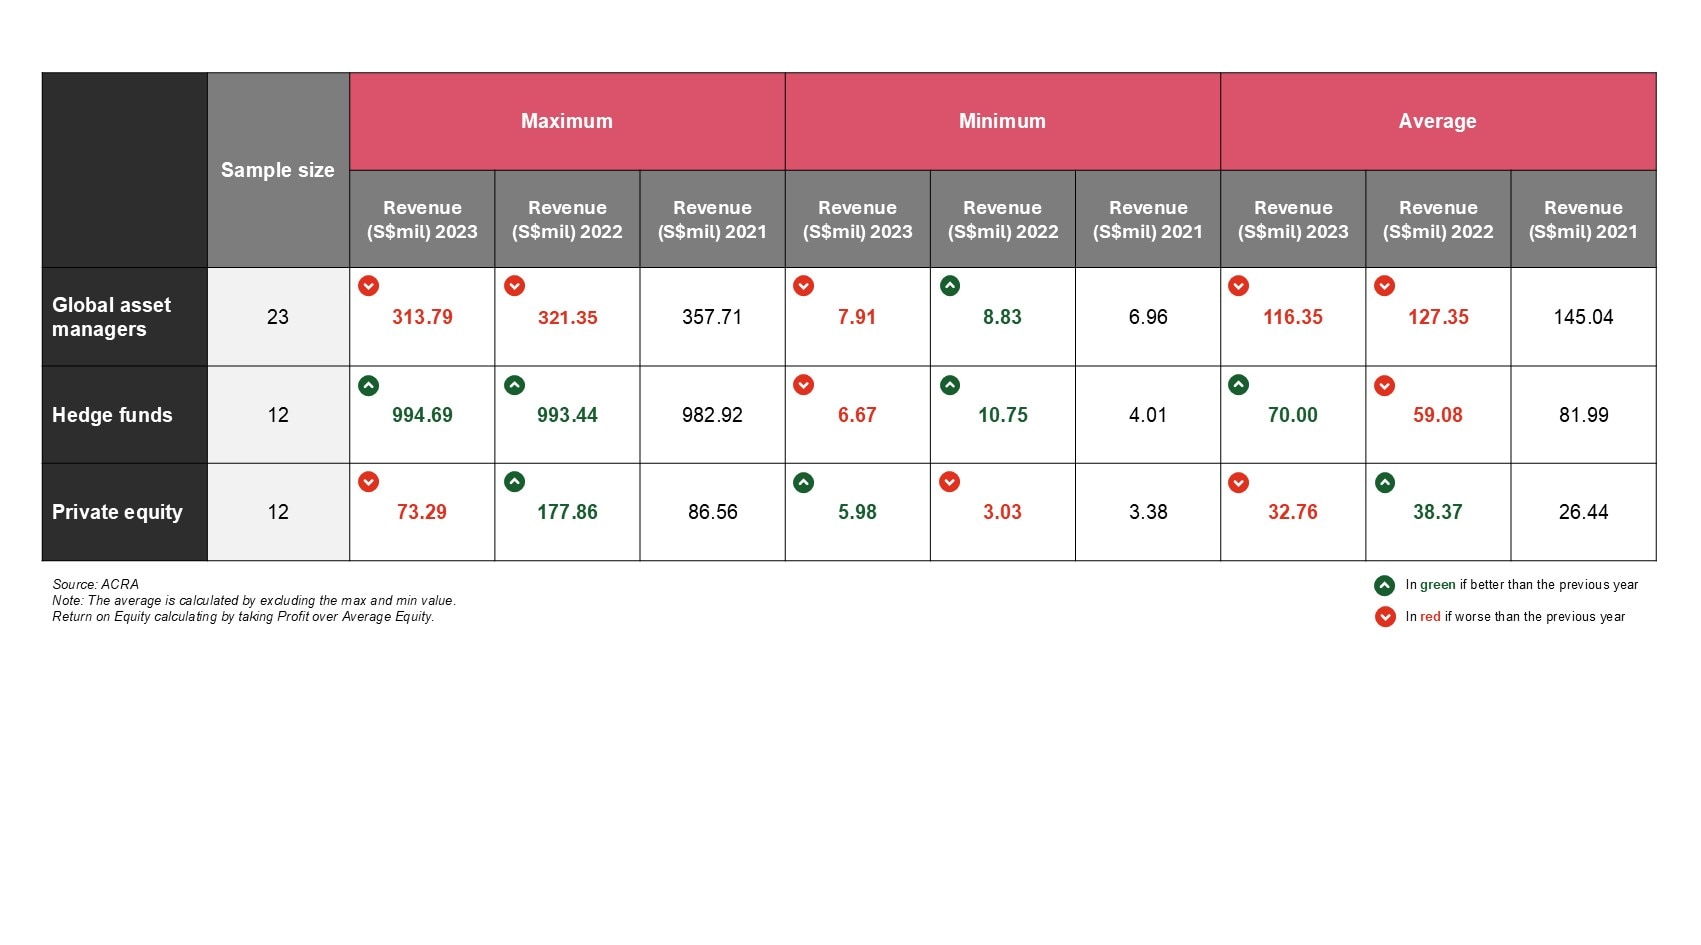
Revenue measures
The revenue streams of asset managers typically consist of management fee, performance and distribution fees. Without considering all other factors such as AUM and headcount, GAMs had the highest average revenue in 2023 at S$116.35mil and PEs had the lowest average revenue at S$32.76mil. HFs are the only group of asset managers to increase their average revenue YoY, with an 18.5% increase.
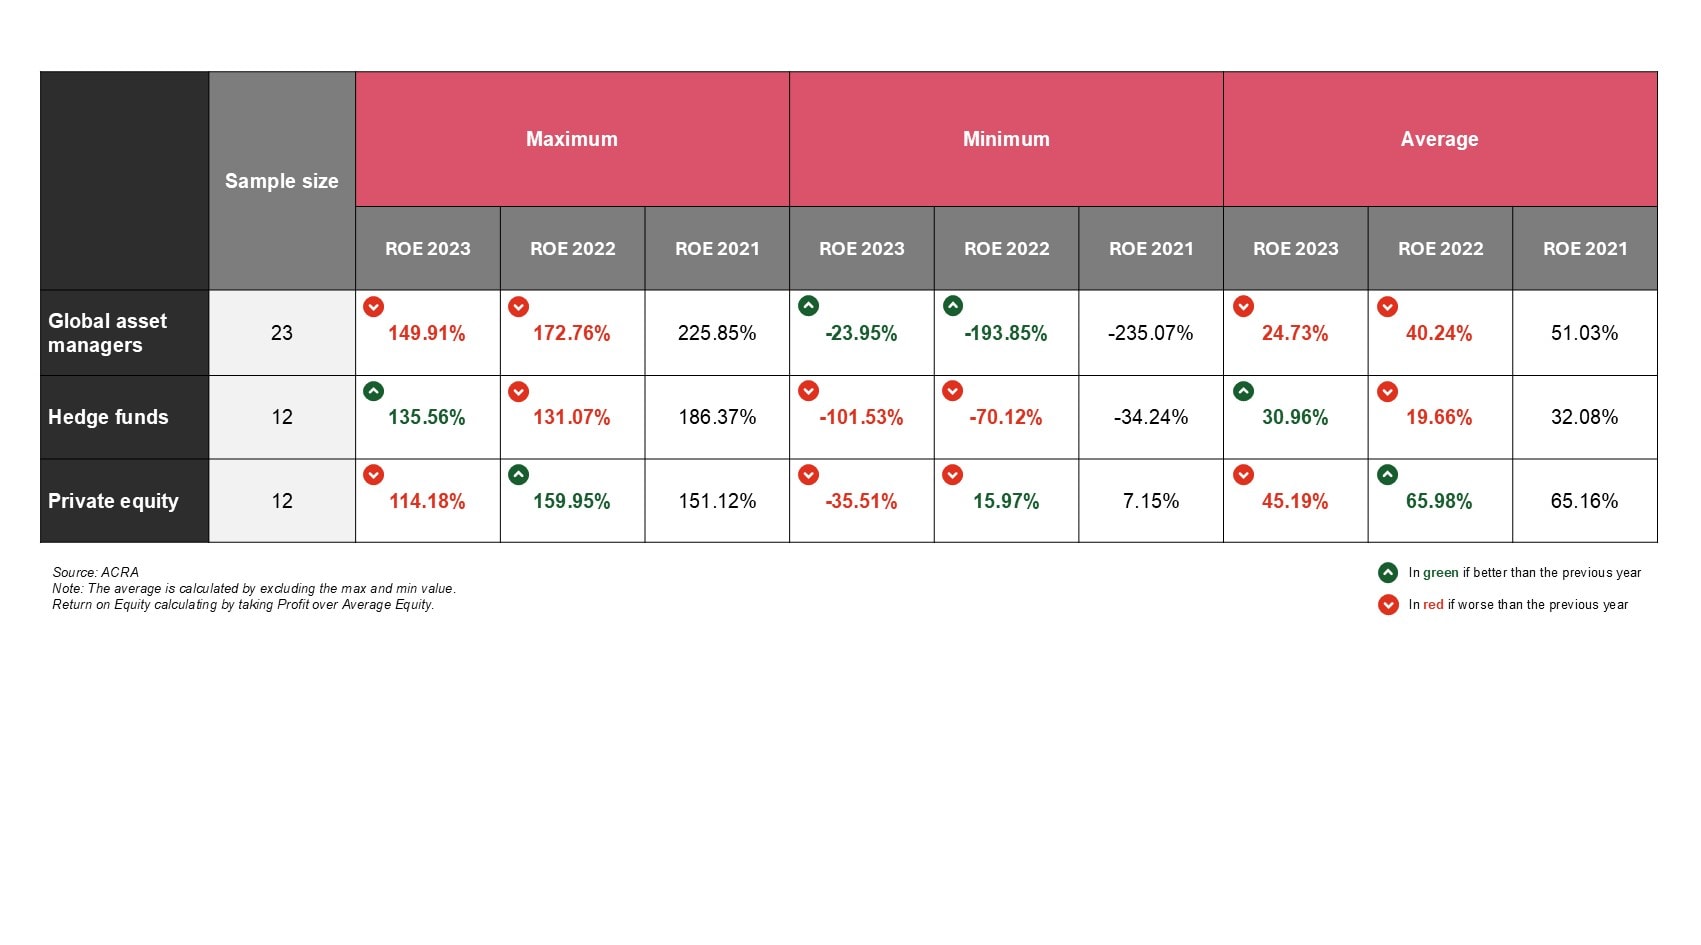
Return on equity
The return on equity (ROE) measures the company’s profitability for shareholders, and therefore a greater figure depicts higher profitability. However, ROE can be affected by various factors such as fee structure, investment performance, AUM growth, operating expenses, client withdrawals and redemptions, etc and should be used in conjunction with other financial ratios. In 2023, PEs had the highest average ROE while GAMs had the lowest ROE. GAMs and PEs have a decrease of roughly 18% while HFs have an increase of 14%.
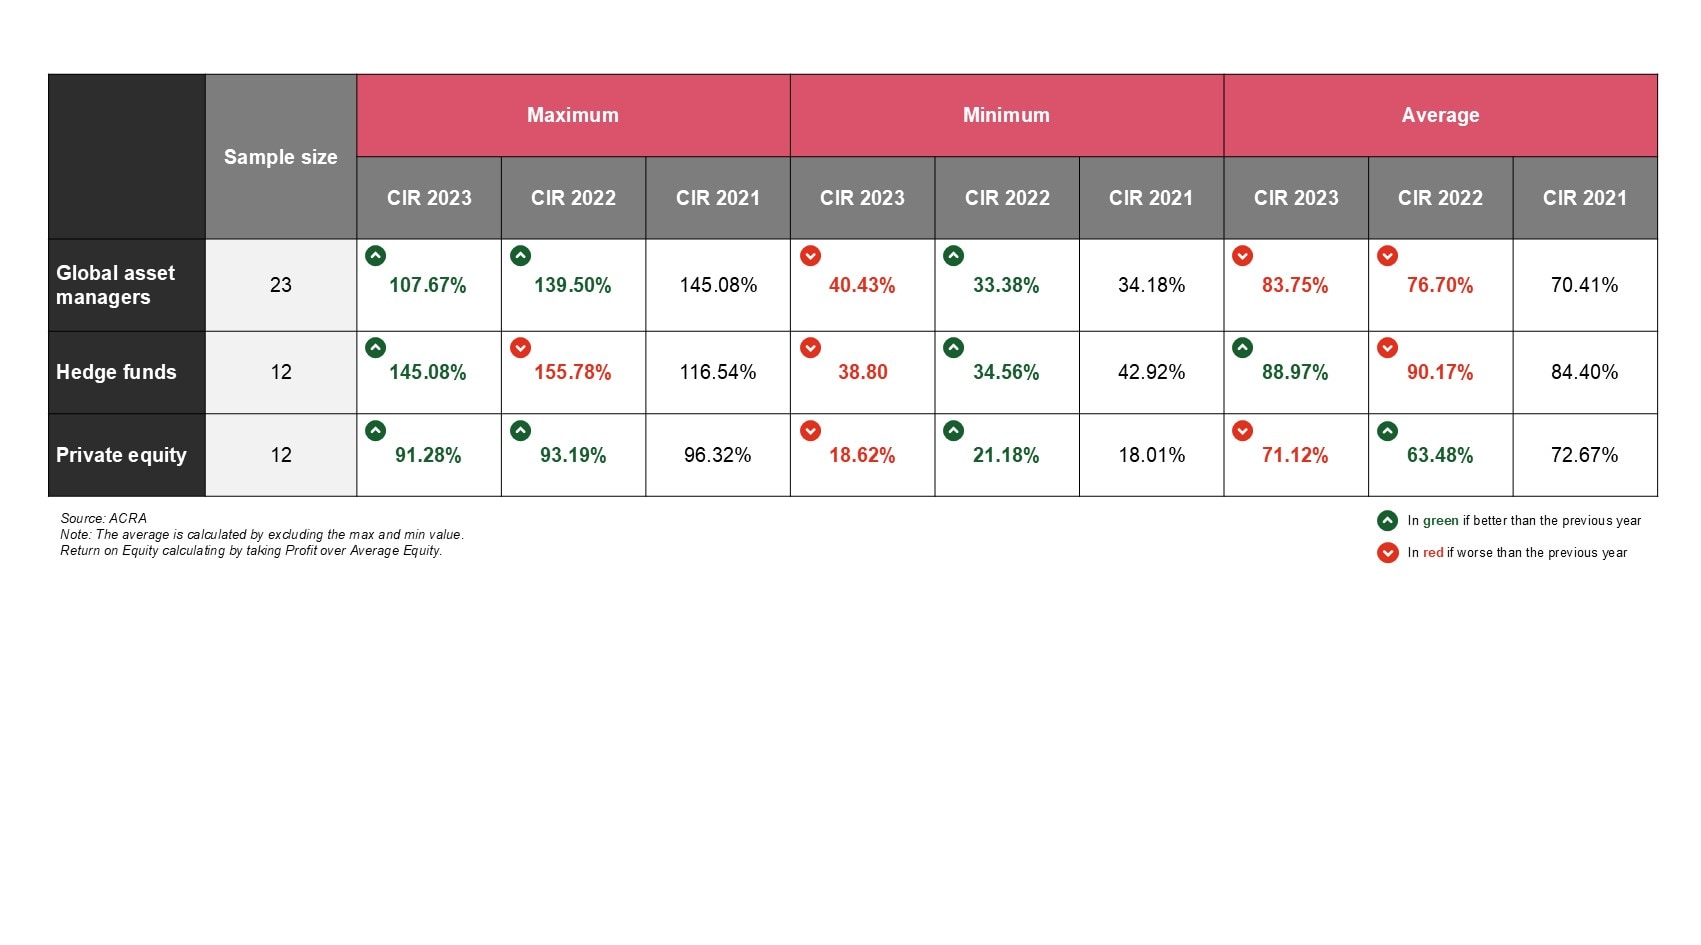
Cost to income ratio
The cost to income ratio (CIR) evaluates the efficiency of a company’s operations. A lower CIR is generally considered better but companies in their early stages might have a higher CIR due to the initial investment required to establish their operations.
In 2023, the average CIR of the groups of asset managers remained above 75%. The average CIR of GAMs and PEs increased by 7.05% and 4.12%, respectively, and that of HFs decreased by 4.78% year on year.
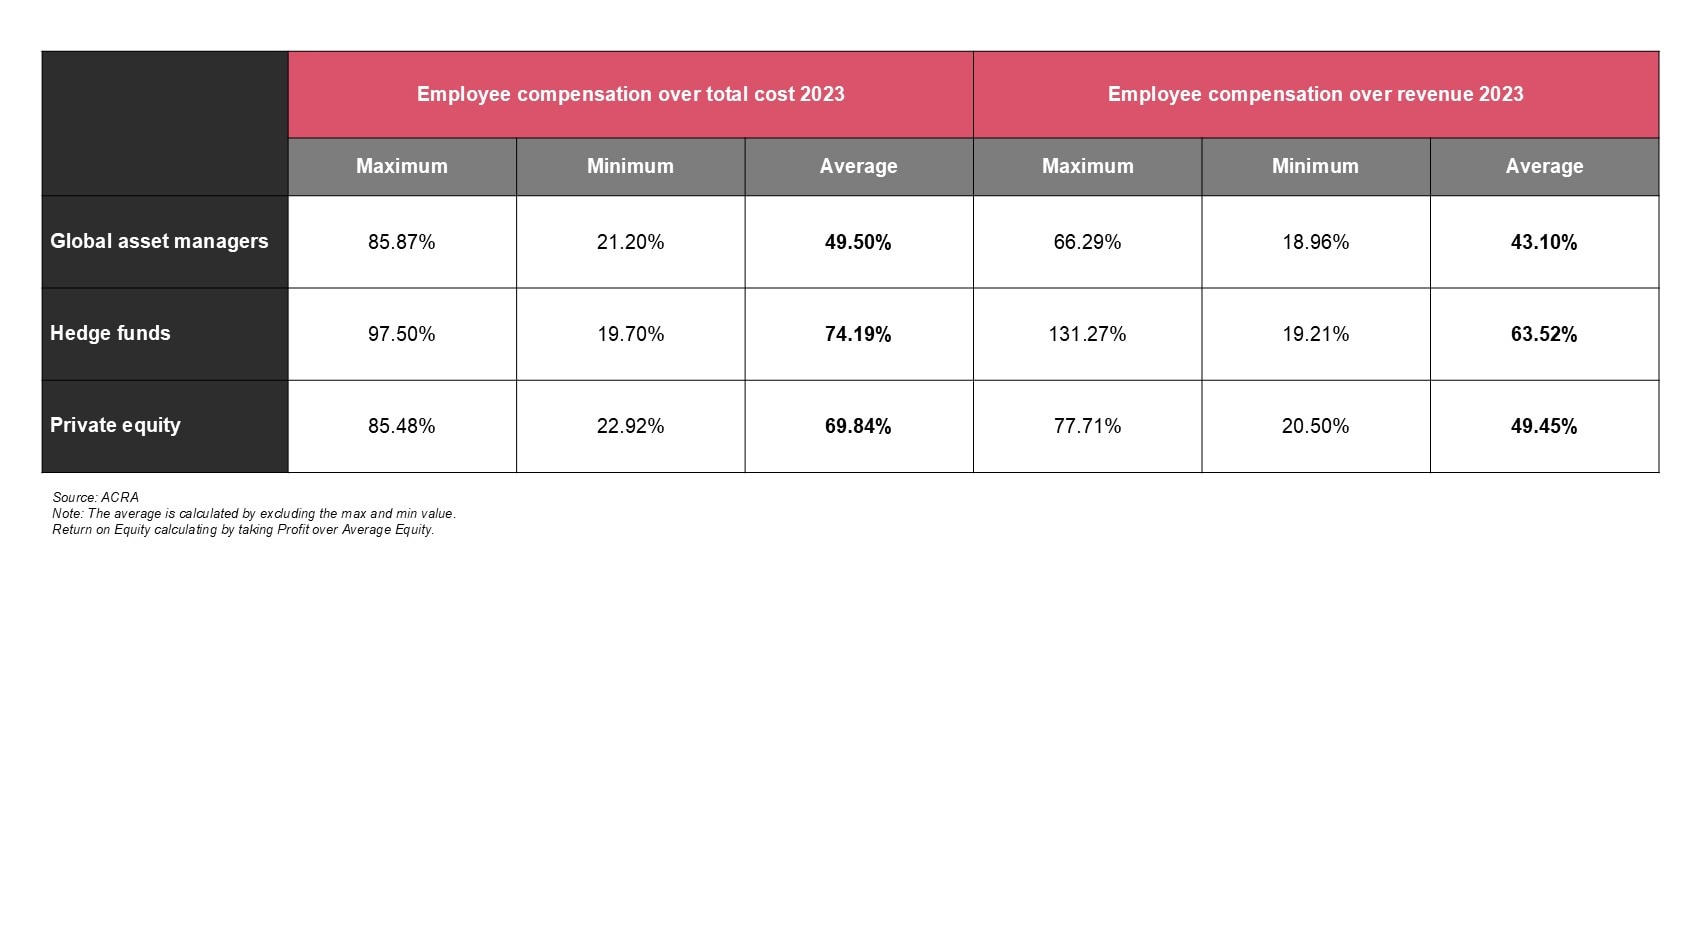
Employee compensation
On average, the employee compensation contributes to over 60% of the total cost across GAMs, HFs, and PEs. Overall, HFs had the highest average employee compensation over total cost and employee compensation over revenue, and GAMs had the lowest value in both.
About the report
The purpose of this benchmarking review is to provide insights into the financial performance of key asset managers in Singapore. The analysis focuses only on the data of their Singapore entity, although many asset managers have operations in multiple countries. When asset manager names are abbreviated, they solely refer to the Singapore entity. Because of the selected types of participants, diverse size and nature of operations as well as differences in the application of transfer pricing policies and accounting policies with regards to recognition and disclosure of rebates, commissions and other fees, these insights should not be considered representative of all asset management firms in Singapore.
In asset management, revenue streams are generated by management, performance as well as distribution fees. As a result, assets under management (AUM) and investment manager capability play a significant role in financial performance. These two factors can vary depending on various factors such as:
- Client base – retail vs institutional investors
- Fund type – mutual funds vs private funds
- Asset classes – equities, bonds, credits, multi-assets, alternative investments
- Investment strategy – long only, absolute return, passive / ETFs, multi-strategies
In carrying out the benchmarking exercise, the information obtained are based on publicly available financial statements, data from the IMAS Members Directory, the Accounting and Corporate Regulatory Authority (ACRA) and other news sources as applicable. This information largely pertains to results for the financial periods ended 31 December 2023, 31 March 2023 and 30 June 2023. Please be advised that data obtained from ACRA is typically available six months following the end of a financial year. As a result, there are some limitations on the information available in terms of comparability especially where financial statements pertain to different reporting periods. For instance, the AUM and headcount of many private equity and hedge fund companies are not publicly available or disclosed. To ensure best comparability, certain adjustments were made especially in relation to fees, rebates and commission expenses – where these have been disclosed as gross expenses, in which these are taken to net off against gross revenue, so all revenue numbers used are adjusted net revenue numbers.
This report analyses the financial performance of 47 asset managers categorized into 23 global asset managers (GAMs), 12 hedge funds (HFs), and 12 private equity firms (PEs). While GAMs typically register their updated AUM and headcount by entity, many HFs and PEs only disclose the aggregated global AUM and headcount due to the nature of their business. Therefore, this report only compares the financial data against AUM and headcount for the 19 GAMs whose numbers are available.